
What is Big Data?
- Traditional techniques insufficient when data grows too:
- Large in volume (massive scales)
- Fast in velocity (high ingestion rates)
- Diverse in variety (structured, unstructured, semi-structured formats)
- Requires new solutions to:
- Combine multiple, disparate, complex datasets
- Process huge volumes of multi-format unstructured/semi-structured data
- Extract insights quickly from rapid data flows
- Uses and benefits:
- Optimize operations by pinpointing inefficiencies
- Gain actionable intelligence for competitive advantages
- Discover new products, services, markets
- Build predictive models for forecasting
- Detect faults, failures, fraud, anomalies
- Maintain comprehensive, detailed records
- Make data-driven decisions from deep insights
- Enable scientific research and discoveries
Data Analysis vs Data Analytics
- Data Analysis
- The process of examining data
- To find patterns, relationships, insights, trends
- Data Analytics
- Broader discipline that includes analysis
- Encompasses full lifecycle management of data:
- Collection, organization, storage
- Integration, cleansing, governance
- Mining, analysis, visualization
- In business: Lowers costs, enables strategic decisions
- In science: Identifies causes, improves predictions
- In services: Optimizes operations, improves quality
Four Categories of Analytics
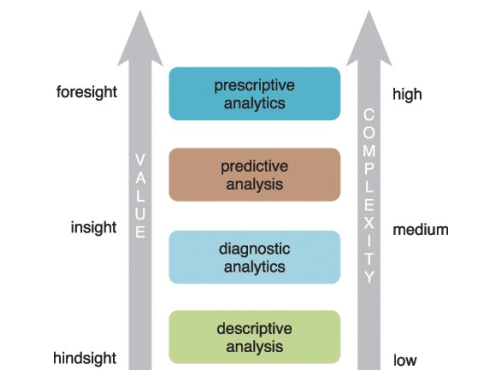
- Descriptive Analytics
- Summarizes what has happened
- Provides context and information on past events
- Techniques: Reports, visualizations, KPI monitoring
- Example: What were sales by product/region?
- Diagnostic Analytics
- Identifies the causes behind past outcomes
- Data mining, drill-downs, discovery
- Example: Why did sales decline in a region?
- Predictive Analytics
- Forecasts what is likely to happen in the future
- Statistical modeling, machine learning, data mining
- Example: What are the chances of customer churn?
- Prescriptive Analytics
- Recommends actions to achieve optimal outcomes
- Uses rules, constraints, optimization, simulations
- Example: How to maximize marketing ROI?
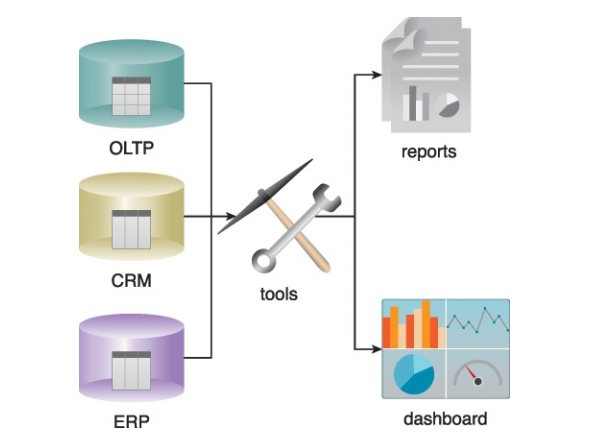
Business Intelligence (BI)
- Applies analytics across entire enterprise
- Provides insights into organizational performance
- Data consolidated into enterprise data warehouses
- Analytics queries and reports displayed on:
- Dashboards
- Scorecards
- Data visualizations
Key Performance Indicators (KPIs)
- Quantifiable metrics to gauge performance
- Aligned to strategic goals and objectives
- Track progress and identify issues
- Visualized on dashboards with target thresholds
- Examples: Sales revenue, customer churn, call times
The 5 V’s of Big Data
- Volume
- Massive scales and quantities of data
- Terabytes, petabytes or more
- Requires special storage and processing
- Velocity
- High speed of data inflows/feeds
- Streaming data, real-time updates
- Demands rapid ingestion and processing
- Variety
- Different data formats and structures
- Structured, unstructured, semi-structured
- Challenges in integration and processing
- Veracity
- Uncertainty, reliability of data
- Data quality, accuracy issues
- Cleansing and transformation needed
- Value
- Extracting usefulness and benefits
- Impacted by data quality, questions asked
- Also storage, cleansing, analysis approach
Data Types
- Structured Data
- Conforms to defined data model/schema
- Database tables, CSV/Excel files
- Relational data from enterprise systems
- Unstructured Data
- Does not follow a pre-defined structure
- Text files, documents, PDFs
- Media files like images, audio, video
- Requires special processing
- Semi-Structured Data
- Some organizational properties
- Hierarchical, nested constructs
- XML, JSON, log files, data feeds
- Metadata
- Data that describes other data
- Technical and business metadata
- Essential for data lineage, context
- Sources, processing steps, definitions


Leave a comment